|
ATCC
human nsclc cell line pc9  Human Nsclc Cell Line Pc9, supplied by ATCC, used in various techniques. Bioz Stars score: 93/100, based on 1 PubMed citations. ZERO BIAS - scores, article reviews, protocol conditions and more https://www.bioz.com/product/biolog+microarray+system+pm+10/pmc09126360-37-0-18?v=ATCC Average 93 stars, based on 1 article reviews
human nsclc cell line pc9 - by Bioz Stars,
2026-07
93/100 stars
|
Buy from Supplier |
|
Sino Biological
recombinant human reg4  Recombinant Human Reg4, supplied by Sino Biological, used in various techniques. Bioz Stars score: 93/100, based on 1 PubMed citations. ZERO BIAS - scores, article reviews, protocol conditions and more https://www.bioz.com/product/biolog+microarray+system+pm+10/pmc04585703-121-13-17?v=Sino+Biological Average 93 stars, based on 1 article reviews
recombinant human reg4 - by Bioz Stars,
2026-07
93/100 stars
|
Buy from Supplier |
|
Novus Biologicals
fzd10  Fzd10, supplied by Novus Biologicals, used in various techniques. Bioz Stars score: 90/100, based on 1 PubMed citations. ZERO BIAS - scores, article reviews, protocol conditions and more https://www.bioz.com/product/biolog+microarray+system+pm+10/pm25406648-350-31-34?v=Novus+Biologicals Average 90 stars, based on 1 article reviews
fzd10 - by Bioz Stars,
2026-07
90/100 stars
|
Buy from Supplier |
|
Novus Biologicals
atg5 antibody  Atg5 Antibody, supplied by Novus Biologicals, used in various techniques. Bioz Stars score: 93/100, based on 1 PubMed citations. ZERO BIAS - scores, article reviews, protocol conditions and more https://www.bioz.com/product/biolog+microarray+system+pm+10/bio_rxiv__2025__05__02__651776-129-21-23?v=Novus+Biologicals Average 93 stars, based on 1 article reviews
atg5 antibody - by Bioz Stars,
2026-07
93/100 stars
|
Buy from Supplier |
|
Novus Biologicals
bio k10 antibody krt10 844  Bio K10 Antibody Krt10 844, supplied by Novus Biologicals, used in various techniques. Bioz Stars score: 94/100, based on 1 PubMed citations. ZERO BIAS - scores, article reviews, protocol conditions and more https://www.bioz.com/product/biolog+microarray+system+pm+10/pmc12581760-165-4-3?v=Novus+Biologicals Average 94 stars, based on 1 article reviews
bio k10 antibody krt10 844 - by Bioz Stars,
2026-07
94/100 stars
|
Buy from Supplier |
|
Thermo Fisher
bovine serum albumin microarray  Bovine Serum Albumin Microarray, supplied by Thermo Fisher, used in various techniques. Bioz Stars score: 99/100, based on 1 PubMed citations. ZERO BIAS - scores, article reviews, protocol conditions and more https://www.bioz.com/product/biolog+microarray+system+pm+10/10__1128_slash_aem__01683___08-59-26-36?v=Thermo+Fisher Average 99 stars, based on 1 article reviews
bovine serum albumin microarray - by Bioz Stars,
2026-07
99/100 stars
|
Buy from Supplier |
|
Corning Life Sciences
epoxy-coated microarray slides Epoxy Coated Microarray Slides, supplied by Corning Life Sciences, used in various techniques. Bioz Stars score: 90/100, based on 1 PubMed citations. ZERO BIAS - scores, article reviews, protocol conditions and more https://www.bioz.com/product/biolog+microarray+system+pm+10/pmc04082371-166-11-14?v=Corning+Life+Sciences Average 90 stars, based on 1 article reviews
epoxy-coated microarray slides - by Bioz Stars,
2026-07
90/100 stars
|
Buy from Supplier |
|
Boster Bio
citrate buffer Citrate Buffer, supplied by Boster Bio, used in various techniques. Bioz Stars score: 95/100, based on 1 PubMed citations. ZERO BIAS - scores, article reviews, protocol conditions and more https://www.bioz.com/product/biolog+microarray+system+pm+10/pmc05772749-91-34-41?v=Boster+Bio Average 95 stars, based on 1 article reviews
citrate buffer - by Bioz Stars,
2026-07
95/100 stars
|
Buy from Supplier |
|
ATCC
atcc vr 1469 pbs Atcc Vr 1469 Pbs, supplied by ATCC, used in various techniques. Bioz Stars score: 98/100, based on 1 PubMed citations. ZERO BIAS - scores, article reviews, protocol conditions and more https://www.bioz.com/product/biolog+microarray+system+pm+10/lucas_taryn_m__2021__glycomics_platforms_to_investigate_influenza_binding_interactions-459-84-84?v=ATCC Average 98 stars, based on 1 article reviews
atcc vr 1469 pbs - by Bioz Stars,
2026-07
98/100 stars
|
Buy from Supplier |
|
Aviva Systems
antibodies for dek  Antibodies For Dek, supplied by Aviva Systems, used in various techniques. Bioz Stars score: 86/100, based on 1 PubMed citations. ZERO BIAS - scores, article reviews, protocol conditions and more https://www.bioz.com/product/biolog+microarray+system+pm+10/pmc03117026-164-33-37?v=Aviva+Systems Average 86 stars, based on 1 article reviews
antibodies for dek - by Bioz Stars,
2026-07
86/100 stars
|
Buy from Supplier |
|
Proteintech
cotl1  Cotl1, supplied by Proteintech, used in various techniques. Bioz Stars score: 93/100, based on 1 PubMed citations. ZERO BIAS - scores, article reviews, protocol conditions and more https://www.bioz.com/product/biolog+microarray+system+pm+10/pmc09856320-45-17-18?v=Proteintech Average 93 stars, based on 1 article reviews
cotl1 - by Bioz Stars,
2026-07
93/100 stars
|
Buy from Supplier |
|
ATCC
forskolin deposited embl ebi e mtab 13352 microarray clariomd human bewo ko wt Forskolin Deposited Embl Ebi E Mtab 13352 Microarray Clariomd Human Bewo Ko Wt, supplied by ATCC, used in various techniques. Bioz Stars score: 93/100, based on 1 PubMed citations. ZERO BIAS - scores, article reviews, protocol conditions and more https://www.bioz.com/product/biolog+microarray+system+pm+10/pm38439971-193-78-108?v=ATCC Average 93 stars, based on 1 article reviews
forskolin deposited embl ebi e mtab 13352 microarray clariomd human bewo ko wt - by Bioz Stars,
2026-07
93/100 stars
|
Buy from Supplier |
Image Search Results
Journal: Clinical and Translational Medicine
Article Title: APE1 shRNA‐loaded cancer stem cell‐derived extracellular vesicles reverse Erlotinib resistance in non‐small cell lung cancer via the IL‐6/STAT3 signalling
doi: 10.1002/ctm2.876
Figure Lengend Snippet: Isolation and characterization of CSC‐EVs as well as their internalization by NSCLC cells. (A) Expression of CSC surface markers (ABCG2 and CD133) in HCC827P‐CSCs and HCC827R‐CSCs, detected by flow cytometry. (B) Cell viability of HCC827P‐CSCs and HCC827R‐CSCs treated with different concentrations of Erlotinib, detected by CCK‐8 assay. (C) Size distribution of EVs derived from HCC827P‐CSCs and HCC827R‐CSCs measured by NTA. (D) Images of TEM observation of HCC827P‐CSCs and HCC827R‐CSCs. (E) Protein bands of EV surface markers (CD63, TSG101 and Calnexin) in Western blot of EVs (labelled E) and cell lysate (labelled CL) in HCC827P‐CSC‐EVs and HCC827R‐CSC‐EVs. (F) Images photographed in fluorescence microscopic observation of green fluorescence PKH67 in HCC827P and PC9P cells following co‐culture with PKH67‐labelled HCC827P‐CSC‐EVs and HCC827R‐CSC‐EVs (DAPI‐labelled nuclei are in blue). * p < .05, compared to HCC827P‐CSCs. Each cell experiment was conducted in triplicate. CSC, cancer stem cell; EV, extracellular vesicle; NSCLC, non‐small cell lung cancer; TEM, transmission electron microscope
Article Snippet:
Techniques: Isolation, Expressing, Flow Cytometry, CCK-8 Assay, Derivative Assay, Western Blot, Fluorescence, Co-Culture Assay, Transmission Assay, Microscopy

Journal: Clinical and Translational Medicine
Article Title: APE1 shRNA‐loaded cancer stem cell‐derived extracellular vesicles reverse Erlotinib resistance in non‐small cell lung cancer via the IL‐6/STAT3 signalling
doi: 10.1002/ctm2.876
Figure Lengend Snippet: Effect of HCC827P‐CSC‐EVs and HCC827R‐CSC‐EVs on the resistance of NSCLC cells to Erlotinib. (A) Expression of Erlotinib resistance‐related genes MDR1, MRP, LRP and ABCG2 in HCC827P and PC9P cells following co‐culture with HCC827P‐CSC‐EVs or HCC827R‐CSC‐EVs, detected by qRT‐PCR and Western blot. (B) Viability of HCC827P and PC9P cells co‐cultured with HCC827P‐CSC‐EVs or HCC827R‐CSC‐EVs and further treated with different concentrations of Erlotinib, detected by CCK‐8 assay. Quantification of the migration (C) and invasion (D) of Erlotinib (5 μM)‐treated HCC827P and PC9P cells in response to co‐culture with HCC827P‐CSC‐EVs or HCC827R‐CSC‐EVs, observed by Transwell assay. (E) Apoptosis of Erlotinib (5 μM)‐treated HCC827P and PC9P cells in response to co‐culture with HCC827P‐CSC‐EVs or HCC827R‐CSC‐EVs, detected by flow cytometry. (F) Protein expression of anti‐apoptotic Bcl‐2 and pro‐apoptotic Bax and cleaved caspase‐3 in Western blot of Erlotinib (5 μM)‐treated HCC827P and PC9P cells in response to co‐culture with HCC827P‐CSC‐EVs or HCC827R‐CSC‐EVs. * p < .05. Each cell experiment was conducted in triplicate. CSC, cancer stem cell; EV, extracellular vesicle; NSCLC, non‐small cell lung cancer
Article Snippet:
Techniques: Expressing, Co-Culture Assay, Quantitative RT-PCR, Western Blot, Cell Culture, CCK-8 Assay, Migration, Transwell Assay, Flow Cytometry

Journal: Clinical and Translational Medicine
Article Title: APE1 shRNA‐loaded cancer stem cell‐derived extracellular vesicles reverse Erlotinib resistance in non‐small cell lung cancer via the IL‐6/STAT3 signalling
doi: 10.1002/ctm2.876
Figure Lengend Snippet: Bioinformatics analysis predicts pathways related to the Erlotinib resistance of NSCLC cells. (A) A volcano plot of Erlotinib resistance–related DEGs in the lung cancer–related GSE69181 microarray. (B) A Venn diagram of up‐regulated DEGs related to Erlotinib resistance and lung cancer–related genes obtained from the GeneCards database, through which 33 genes were identified. (C) PPI analysis of the 33 candidate genes using the String database. (D) Top 15 core genes in the protein interaction network in PPI analysis. (E) A heat map of the expression of IL‐6 in Erlotinib‐resistant samples in the GSE69181 microarray. (F) The expression of APE1 in the tumour and normal tissue samples from the GEPIA2 database. (G) The correlation of APE1 expression with disease‐free survival of lung cancer patients analysed by the GEPIA2 database. The lung cancer patients were divided into a high and a low expression group according to the median value of APE1 expression. (H) The expression of IL‐6 in Erlotinib‐resistant samples in the GSE69181 microarray. qRT‐PCR measurement of APE1 mRNA expression in clinically collected NSCLC tissues and adjacent normal tissues ( n = 67). (I) ELISA analysis of IL‐6 protein content in serum samples of healthy controls ( n = 35) and NSCLC patients ( n = 67). (J) Pearson correlation analysis of APE1 expression and IL‐6 expression in NSCLC tissues ( n = 67). (K) qRT‐PCR measurement of APE1 mRNA expression in HCC827P, PC9P, HCC827R and PC9R cells. * p < .05. Each cell experiment was conducted in triplicate. APE1, apurinic endonuclease 1; DEG, differentially expressed gene; IL‐6, interleukin‐6; NSCLC, non‐small cell lung cancer; PPI, protein–protein interaction
Article Snippet:
Techniques: Microarray, Expressing, Quantitative RT-PCR, Enzyme-linked Immunosorbent Assay

Journal: Clinical and Translational Medicine
Article Title: APE1 shRNA‐loaded cancer stem cell‐derived extracellular vesicles reverse Erlotinib resistance in non‐small cell lung cancer via the IL‐6/STAT3 signalling
doi: 10.1002/ctm2.876
Figure Lengend Snippet: APE1 affects the Erlotinib resistance of NSCLC cells through mediating the IL‐6/STAT3 signalling. (A) The protein expression of APE1 and p‐STAT3/STAT3 in HCC827R and PC9R cells treated by Erlotinib alone or in combination with shAPE1, measured by the Western blot. (B) The content of IL‐6 in the supernatant of HCC827R and PC9R cells treated by Erlotinib alone or in combination with shAPE1, detected by ELISA. (C) Cell viability in HCC827R and PC9R cells treated by Erlotinib alone or in combination with shAPE1, detected by CCK‐8 assay. Quantification of the migration (D) and invasion (E) in HCC827R and PC9R cells treated by Erlotinib alone or in combination with shAPE1, observed in the Transwell assay. (F) The apoptosis of HCC827R and PC9R cells treated by Erlotinib alone or in combination with shAPE1, tested by flow cytometry. (G) The protein expression of Bcl‐2, Bax and cleaved caspase‐3 in HCC827R and PC9R cells treated by Erlotinib alone or in combination with shAPE1, measured by the Western blot. (H) The mRNA and protein expression of MDR1, MRP, LRP and ABCG2 in CC827R and PC9R cells treated by Erlotinib alone or in combination with shAPE1, measured by qRT‐PCR and Western blot. * p < .05. Each cell experiment was conducted in triplicate. APE1, apurinic endonuclease 1; IL‐6, interleukin‐6; NSCLC, non‐small cell lung cancer
Article Snippet:
Techniques: Expressing, Western Blot, Enzyme-linked Immunosorbent Assay, CCK-8 Assay, Migration, Transwell Assay, Flow Cytometry, Quantitative RT-PCR

Journal: Clinical and Translational Medicine
Article Title: APE1 shRNA‐loaded cancer stem cell‐derived extracellular vesicles reverse Erlotinib resistance in non‐small cell lung cancer via the IL‐6/STAT3 signalling
doi: 10.1002/ctm2.876
Figure Lengend Snippet: Effects of HCC827R‐CSC‐EVs loaded with APE1 shRNA on the Erlotinib resistance of NSCLC cells in vitro. (A) The enrichment of APEX1 (APE1) in EVs of different origins, analysed using the ExoRBase database. (B) The mRNA expression of APE1 in HCC827P‐CSCs, HCC827R‐CSCs, HCC827P‐CSC‐EVs and HCC827R‐CSC‐EVs determined by qRT‐PCR assay. (C) The mRNA expression of APE1 in HCC827R‐CSCs and HCC827R‐CSC‐EVs in response to shAPE1 treatment, determined by qRT‐PCR assay. (D) The mRNA expression of APE1 in HCC827P and PC9P cells in response to co‐culture with HCC827R‐CSCs EVs shAPE1 determined by qRT‐PCR assay. (E) Western blot measurement of the protein expression of p‐STAT3/STAT3 in HCC827P and PC9P cells in response to co‐culture with HCC827R‐CSCs EVs shAPE1. (F) ELISA detection of the content of IL‐6 in the supernatant of HCC827P and PC9P cells in response to co‐culture with HCC827R‐CSCs EVs shAPE1. (G) Cell viability in HCC827P and PC9P cells in response to co‐culture with HCC827R‐CSCs EVs shAPE1 and further treatment with Erlotinib, detected by CCK‐8 assay. Quantification of the migration (H) and invasion (I) in HCC827P and PC9P cells in response to co‐culture with HCC827R‐CSCs EVs shAPE1 and further treatment with Erlotinib (5 μM), detected by the Transwell assay. (J) Cell apoptosis in HCC827P and PC9P cells in response to co‐culture with HCC827R‐CSCs EVs shAPE1 and further treatment with Erlotinib (5 μM), detected by flow cytometry. (K) Protein expression of anti‐apoptotic Bcl‐2 and pro‐apoptotic Bax and cleaved caspase‐3 in the Western blot of Erlotinib (5 μM)‐treated HCC827P and PC9P cells in response to co‐culture with HCC827R‐CSCs EVs shAPE1. (L) The expression of MDR1, MRP, LRP and ABCG2 in Erlotinib (5 μM)‐treated HCC827P and PC9P cells in response to co‐culture with HCC827R‐CSCs EVs shAPE1 measured by qRT‐PCR and the Western blot. * p < .05. Each cell experiment was conducted in triplicate. APE1, apurinic endonuclease 1; CSC, cancer stem cell; EV, extracellular vesicle; IL‐6, interleukin‐6; NSCLC, non‐small cell lung cancer; shRNA, short hairpin RNA
Article Snippet:
Techniques: shRNA, In Vitro, Expressing, Quantitative RT-PCR, Co-Culture Assay, Western Blot, Enzyme-linked Immunosorbent Assay, CCK-8 Assay, Migration, Transwell Assay, Flow Cytometry

Journal: Clinical and Translational Medicine
Article Title: APE1 shRNA‐loaded cancer stem cell‐derived extracellular vesicles reverse Erlotinib resistance in non‐small cell lung cancer via the IL‐6/STAT3 signalling
doi: 10.1002/ctm2.876
Figure Lengend Snippet: Effects of shAPE1‐loaded HCC827R‐CSC‐EVs on the Erlotinib resistance of NSCLC cells in nude mice. Nude mice were treated with Erlotinib, Erlotinib + HCC827R‐CSC‐EVs or Erlotinib + HCC827R‐CSC‐EVs shAPE1. (A) The volume of tumour xenografts at different time points. (B) The weight of isolated tumour xenografts in mice. (C) ELISA detection of IL‐6 protein levels in tumour tissues of mice. (D) The Western blot measurement of the protein expression of APE1, p‐STAT3 and STAT3 in tumour tissues of mice. (E) The Western blot measurement of anti‐apoptotic Bcl‐2 and pro‐apoptotic Bax and cleaved caspase‐3 in tumour tissue of mice. (F) The expression of MDR1, MRP, LRP and ABCG2 in tumour tissues of mice measured by qRT‐PCR and Western blot. * p < .05. n = 8. APE1, apurinic endonuclease 1; CSC, cancer stem cell; EV, extracellular vesicle; IL‐6, interleukin‐6; NSCLC, non‐small cell lung cancer
Article Snippet:
Techniques: Isolation, Enzyme-linked Immunosorbent Assay, Western Blot, Expressing, Quantitative RT-PCR

Journal: Clinical and Translational Medicine
Article Title: APE1 shRNA‐loaded cancer stem cell‐derived extracellular vesicles reverse Erlotinib resistance in non‐small cell lung cancer via the IL‐6/STAT3 signalling
doi: 10.1002/ctm2.876
Figure Lengend Snippet: The molecular mechanism underlying the effect of shAPE1‐loaded RCSC‐EVs on the Erlotinib resistance in NSCLC. shAPE1‐loaded RCSC‐EVs suppress the activation of the IL‐6/STAT3 signalling and thereby reverse the resistance of NSCLC cells to Erlotinib. EV, extracellular vesicle; IL‐6, interleukin‐6; NSCLC, non‐small cell lung cancer
Article Snippet:
Techniques: Activation Assay
Journal: Scientific Reports
Article Title: REG4 is a transcriptional target of GATA6 and is essential for colorectal tumorigenesis
doi: 10.1038/srep14291
Figure Lengend Snippet: ( a ) HT29 cells were infected with a lentivirus encoding an shRNA targeting GATA6, and lysates were subjected to immunoblotting analysis with anti-GATA6 antibody. α-tubulin served as a loading control. ( b ) qRT-PCR quantitation of REG4 and LGR5 was performed using total RNA from HT29 cells infected with a lentivirus encoding an shRNA targeting GATA6. Values represent the mean ± s.e.m. (n = 4). Actin served as an internal control. **P < 0.01, ***P < 0.001. ( c ) qRT-PCR quantitation of REG4 and LGR5 was performed using total RNA from HT29 cells infected with a lentivirus encoding an shRNA targeting REG4 or LGR5. Values represent the mean ± s.e.m. (n = 3). Actin served as an internal control. ***P < 0.001. ( d ) Nude mice (n = 8 per group) were injected subcutaneously with HT29 cells expressing the indicated shRNAs, and tumor formation was monitored. Values represent the mean ± s.e.m. *P < 0.05, **P < 0.01. ( e ) qRT-PCR analysis of REG4 expression in human colon tumors and surrounding normal tissues. The amount of REG4 and Axin2 mRNA is shown as the percentage of the amount of HPRT1 mRNA (n = 23 pairs). Filled circles represent tumor tissues in which the indicated mRNA is expressed at a higher level than in the corresponding non-tumor tissues. Axin2 was used as a marker for the activation of Wnt/β-catenin signaling. *P < 0.05, **P < 0.01.
Article Snippet: After 24 h, the media were replaced with fresh media containing 10 nM
Techniques: Infection, shRNA, Western Blot, Quantitative RT-PCR, Quantitation Assay, Injection, Expressing, Marker, Activation Assay

Journal: Scientific Reports
Article Title: REG4 is a transcriptional target of GATA6 and is essential for colorectal tumorigenesis
doi: 10.1038/srep14291
Figure Lengend Snippet: ( a ) Lysates prepared from HT29 and LS180 cells transfected with siRNA targeting GATA6 were subjected to immunoblotting analysis with anti-GATA6 antibody. α-tubulin served as a loading control. ( b ) qRT-PCR analysis of REG4 and LGR5 was performed using total RNA from HT29 and LS180 cells transfected with siRNA against GATA6. GAPDH served as an internal control. Values represent the mean ± s.e.m. (n = 6). ***P < 0.001. ( c ) (Left) Luciferase (Luc) reporter constructs containing the fragments of the REG4 promoter region. Potential GATA-binding motifs (A/TGATAA/G) are represented by ellipses and primer pairs used in ChIP assays are indicated as P1 and P2, respectively. The mutated elements are shown with the cross mark. (Right) HT29 and LS180 cells were transfected with the indicated promoter constructs and luciferase activity was measured. Values represent the mean ± s.d. (n = 3). ***P < 0.001. ( d ) Luciferase assays were performed using LS180 cells that had been transfected with GATA6 or control siRNA and then with the REG4 reporter construct. Values represent the mean ± s.d. (n = 4). ***P < 0.001. ( e ) ChIP analysis of the REG4 promoter in LS180 cells using antibody against GATA6 or rabbit IgG. The positions of primers used for PCR are indicated by arrows in . GAPDH and USP12 promoter regions served as negative and positive controls, respectively. Values represent the mean ± s.e.m. (n = 3). **P < 0.01. ( f ) Comparison of GATA6 and REG4 expression in colon cancer cell lines by immunoblotting (upper) and qRT-PCR (lower) analyses. Lysates prepared from the indicated cells were analysed by immunoblotting with antibody against GATA6. α-tubulin served as a loading control. GAPDH served as an internal control. Values represent the mean ± s.d. (n = 2).
Article Snippet: After 24 h, the media were replaced with fresh media containing 10 nM
Techniques: Transfection, Western Blot, Quantitative RT-PCR, Luciferase, Construct, Binding Assay, Activity Assay, Expressing

Journal: Scientific Reports
Article Title: REG4 is a transcriptional target of GATA6 and is essential for colorectal tumorigenesis
doi: 10.1038/srep14291
Figure Lengend Snippet: ( a ) qRT-PCR analysis of REG4 and LGR5 was performed using total RNA from HT29 and LS180 cells transfected with REG4- or LGR5-specific or control siRNAs. GAPDH served as an internal control. Values represent the mean ± s.e.m. (n = 3). ***P < 0.001. ( b , c ) Effects of REG4 ( b ), GATA6 or LGR5 ( c ) knockdown on the growth of HT29 (left) and LS180 (right) cells cultured under adherent conditions. Cells transfected with the indicated siRNAs were plated at the density of 1.25 × 10 4 cells into 48-well plates and cell numbers were counted after 3 and 5 days. Values represent the mean ± s.e.m. (n = 3). *P < 0.05, **P < 0.01, ***P < 0.001. ( d ) Treatment with recombinant human REG4 (rREG4) restores the growth of GATA6-knockdown HT29 and LS180 cells. Recombinant REG4 was added to the culture medium and cell counts were performed after 7 days of culture. Values represent the mean ± s.e.m. (n = 3). ( e ) Microarray analysis of genes regulated by GATA6, REG4 or LGR5 in HT29 cells. Venn diagram of genes downregulated by GATA6 (blue), REG4 (orange) or LGR5 (green) knockdown. The significance of the overlap was calculated by hypergeometric distribution (P = 0). The number of genes within each category is indicated. ( f ) GO analysis of the genes shared by the GATA6 and REG4 signatures indicated in ( e ). Significance is expressed as GO enrichment scores (-Log P-value). ( g ) GO analysis of the genes shared by the GATA6 and LGR5 signatures indicated in ( e ).
Article Snippet: After 24 h, the media were replaced with fresh media containing 10 nM
Techniques: Quantitative RT-PCR, Transfection, Cell Culture, Recombinant, Microarray

Journal: Scientific Reports
Article Title: REG4 is a transcriptional target of GATA6 and is essential for colorectal tumorigenesis
doi: 10.1038/srep14291
Figure Lengend Snippet: ( a , b ) Lysates from HT29 and LS180 cells transfected with pre-miR-363 or control miRNA were subjected to immunoblotting analysis with anti-GATA6 antibody ( a ). qRT-PCR analysis of REG4 and LGR5 was performed using total RNA from these cells ( b ). α-tubulin served as a loading control. GAPDH served as an internal control. Values represent the mean ± s.e.m. (n = 4). ***P < 0.001. ( c ) SW403 cells were treated with antisense oligonucleotide targeting miR-363, followed by immunoblotting analysis with anti-GATA6 antibody (left) or qRT-PCR analysis of REG4 (right). Values represent the mean ± s.e.m. (n = 3). *P < 0.05. ( d ) Treatment with recombinant REG4 restores the growth of HT29 and LS180 cells infected with miR-363 expressing lentivirus. Human recombinant REG4 was added to the culture medium and the number of cells was counted after 7 days of culture. Values represent the mean ± s.e.m. (n = 3).
Article Snippet: After 24 h, the media were replaced with fresh media containing 10 nM
Techniques: Transfection, Western Blot, Quantitative RT-PCR, Recombinant, Infection, Expressing

Journal: Scientific Reports
Article Title: REG4 is a transcriptional target of GATA6 and is essential for colorectal tumorigenesis
doi: 10.1038/srep14291
Figure Lengend Snippet: The expression of GATA6 is enhanced in colon cancer cells because miR-363 is downregulated. GATA6 simultaneously activates the transcription of genes required for growth (REG4) and clonogenicity (LGR5), and cooperation between the GATA6/REG4 and GATA6/LGR5 pathways may be important for the tumorigenicity of colon cancer cells.
Article Snippet: After 24 h, the media were replaced with fresh media containing 10 nM
Techniques: Expressing
Journal: Nature communications
Article Title: BRMS1L suppresses breast cancer metastasis by inducing epigenetic silence of FZD10.
doi: 10.1038/ncomms6406
Figure Lengend Snippet: Figure 3 | BRMS1L inhibits breast cancer cell invasion and EMT via suppressing FZD10 expression. (a) mRNA microarray (GSE61354) analysis reveals mRNA differentially expressed in MDA-MB-231 cells transfected with pcDNA3 vector carrying BRMS1L (BRMS1L) or negative control (NC) for 24 h. (b) qRT–PCR for the mRNA expression of WNT2B, WNT7A, WNT9B, WNT10B, FRAT1, FZD10, VANGL2, BMP8A, CAMK3B in mRNA microarray. ***Po0.001 as compared with NC. Bars correspond to mean±s.d. The data are representative of three independent experiments. Student’s t-test was used for the comparison of two independent groups. (c) Western blotting for BRMS1L and FZD10 in T47D cells that were untreated (UT), mock transfected (mock) or transfected with GFP-siRNA or two BRMS1L-siRNAs. (d) Western blotting for BRMS1L and FZD10 in MDA-MB-231 cells that were transfected with pcDNA3 vector carrying BRMS1L (BRMS1L) or negative control (NC). (e) E-cadherin and vimentin protein expression levels measured by western blotting in MCF-10A cells that were untreated (UT), mock transfected (mock) or transfected with GFP-siRNA or two FZD10-siRNAs. (f,g) Invasion of cancer cells measured by Boyden chamber assays for BT-474 (f) and MDA-MB-231 cells (g) treated as indicated. Bars correspond to mean±s.d. ***Po0.001 as compared with mock. Scale bars correspond to 50 mm. Student’s t-test was used for the comparison of two independent groups. (h) Immunohistochemical staining for FZD10 in primary breast cancer with or without regional lymph nodes (LN) metastasis and metastatic lymph nodes (LNMs). Scale bar corresponds to 50 mm. BRL, BRMS1L; E-cad, E-cadherin; Vim, Vimentin.
Article Snippet: Protein extracts were resolved in 8–15% SDS–polyacrylamide gel electrophoresis, transferred to polyvinylidene difluoride membranes and probed with antibodies against E-cadherin (1:1,000, 3195S, CST), vimentin (1:1,000, AF2105, R&D), BRMS1L (1:1,000, NBP2-14362, Novus),
Techniques: Expressing, Microarray, Transfection, Plasmid Preparation, Negative Control, Quantitative RT-PCR, Comparison, Western Blot, Immunohistochemical staining, Staining

Journal: Nature communications
Article Title: BRMS1L suppresses breast cancer metastasis by inducing epigenetic silence of FZD10.
doi: 10.1038/ncomms6406
Figure Lengend Snippet: Figure 5 | BRMS1L suppresses WNT3/FZD10/b-catenin pathway. (a) Wnt/b-catenin activity measured by TCF/LEF luciferase reporter assays in T47D cells that were mock transfected (mock), or transfected with GFP-siRNA or two BRMS1L-siRNAs and in MDA-MB-231 cells that were transfected with pcDNA3 vector carrying BRMS1L (BRMS1L) or negative control (NC). Bars correspond to mean±s.d., ***Po0.001 as compared with GFP-siRNA, ###Po0.001 as compared with NC. (b,c) Wnt/b-catenin activities measured by TCF/LEF luciferase assays in MDA-MB-231 (b) and T47D cells (c) treated as indicated. Bars correspond to mean±s.d. **Po0.001 as compared with BRMS1L or BRMS1L-siRNA1. (d,e) Western blotting for nuclear (n) and cytoplasm (c) b-catenin in MDA-MB-231 (d) and T47D cells (e) treated as indicated. (f,g) Wnt/b-catenin activities measured by TCF/LEF luciferase assays (f) and b-catenin translocation (g) in MDA-MB-231cells treated as indicated. ***Po0.001 as compared with GFP-siRNA. (h,i) Wnt/b-catenin activities measured by TCF/LEF b-catenin translocation (h) and luciferase assays (i) in T47D cells treated as indicated. ***Po0.001 as compared with BRMS1L-siRNA1. b-cat, b-catenin; BRL, BRMS1L. Bars correspond to mean±s.d. These data are representative of three independent experiments. Student’s t-test was used for the comparison of two independent groups in a,b,c,f,i.
Article Snippet: Protein extracts were resolved in 8–15% SDS–polyacrylamide gel electrophoresis, transferred to polyvinylidene difluoride membranes and probed with antibodies against E-cadherin (1:1,000, 3195S, CST), vimentin (1:1,000, AF2105, R&D), BRMS1L (1:1,000, NBP2-14362, Novus),
Techniques: Activity Assay, Luciferase, Transfection, Plasmid Preparation, Negative Control, Western Blot, Translocation Assay, Comparison

Journal: Nature communications
Article Title: BRMS1L suppresses breast cancer metastasis by inducing epigenetic silence of FZD10.
doi: 10.1038/ncomms6406
Figure Lengend Snippet: Figure 7 | BRMS1L inhibits liver metastasis of breast tumour xenografts without influencing orthotopic tumour incidence and growth rate. (a) The number of metastatic liver nodules in mice xenografted with breast cancer cells as indicated. The bars correspond to the mean±s.d. ***Po0.001 compared with GFP-shRNA. ###Po0.001 as compared with NC (n ¼ 8 per group). Student’s t-test was used for the comparison of two independent groups. (b) Expression of human HPRT mRNA relative to mouse 18S rRNA in the liver. Bars correspond to mean±s.d. Eight independent experiments were repeated (each mouse sample was considered as one independent experiment. Five technological replications were repeated in each sample.). Student’s t-test was used for the comparison of two independent groups. (c) Haematoxylin and eosin (H&E) staining for tumour xenografts and liver metastases of mice xenografted with breast cancer cells as indicated. Scale bars correspond to 50 mm. (d) Immunohistochemical staining for BRMS1L and FZD10 expression in tumour xenografts of mice xenografted with breast cancer cells as indicated. Scale bars correspond to 50 mm.BRL, BRMS1L.
Article Snippet: Protein extracts were resolved in 8–15% SDS–polyacrylamide gel electrophoresis, transferred to polyvinylidene difluoride membranes and probed with antibodies against E-cadherin (1:1,000, 3195S, CST), vimentin (1:1,000, AF2105, R&D), BRMS1L (1:1,000, NBP2-14362, Novus),
Techniques: shRNA, Comparison, Expressing, Staining, Immunohistochemical staining

Journal: Nature communications
Article Title: BRMS1L suppresses breast cancer metastasis by inducing epigenetic silence of FZD10.
doi: 10.1038/ncomms6406
Figure Lengend Snippet: Figure 8 | Schematic summary of the miR106b-BRMS1L-FZD10 signalling pathway.
Article Snippet: Protein extracts were resolved in 8–15% SDS–polyacrylamide gel electrophoresis, transferred to polyvinylidene difluoride membranes and probed with antibodies against E-cadherin (1:1,000, 3195S, CST), vimentin (1:1,000, AF2105, R&D), BRMS1L (1:1,000, NBP2-14362, Novus),
Techniques:
Journal: bioRxiv
Article Title: Loss of ATG5 expression in a subset of human prostate cancers promotes tumor growth through accumulation of p62
doi: 10.1101/2025.05.02.651776
Figure Lengend Snippet: ( A ) Visualization of the deletions, amplifications, and somatic mutations of ATG5 and other PCa-associated genes from the TCGA prostate adenocarcinoma (PRAD) dataset (n = 492). The image was exported from cBioPortal. ( B ) Genome-wide somatic copy number alterations (SCNAs) from 97 curated and paired TCGA PRAD samples. Frequently altered autophagy-related (ATG) genes are highlighted below, along with neighboring oncogenes or tumor suppressor genes. The image was exported from Nexus Copy Number™. ( C ) Oncomine™ analysis of microarray mRNA expression datasets for ATG5 and other PCa-associated genes. Genes are ranked based on the significance of mRNA under-expression in prostate tumors compared to normal tissue. Genes ranking in the top 25%, 10%, 5% and 1% of all examined genes in a given dataset are indicated with increasingly deep blue color. The p-value for a given gene was calculated from the median ranks across all 15 microarray datasets. ( D ) Oncomine™ analysis of PCa-related genes for prostate metastases compared to primary tumors. See also Supplementary Figure S1 and Supplementary Figure S2A.
Article Snippet: Slides were cooled for 20 min, washed with water, blocked with Biocare Blocking Reagent (#BS966M) for 10 min and incubated in
Techniques: Genome Wide, Microarray, Expressing
![( A ) Tukey boxplot of ATG5 mRNA expression levels in normal prostate tissue, low-grade (Gleason score ≤7) tumors, and high-grade (Gleason score >8) tumors from the TCGA PRAD dataset (*, p<0.01; **, p<0.0001). ( B ) Kaplan-Meier curves comparing overall survival of TCGA PRAD patients possessing tumors with high or low ATG5 mRNA expression. The Mantel-Haenszel hazard ratio (HR) was determined, along with the 95% confidence interval (CI) and Log-rank test p-value (p<0.05). ( C ) Quantification of ATG5 IHC staining was determined from patient samples (N=28) with ≥3 benign and tumor glands for in-patient comparison using the following equation: H-score = [1 x (% cells 1+) + 2 x (% cells 2+) + 3 x (% cells 3+)]. Statistical significance (p<0.0001) was determined using a two-tailed Mann Whitney test in Prism10. ( D ) Representative images of ATG5 staining from benign glandular regions and tumor regions from human prostate tumors of GS7-9. Scale bar represents 100 μm. Dashed box areas are magnified within the insets.](https://bio-rxiv-images-cdn.bioz.com/dois_ending_with_76/10__1101_slash_2025__05__02__651776/10__1101_slash_2025__05__02__651776___F2.large.jpg)
Journal: bioRxiv
Article Title: Loss of ATG5 expression in a subset of human prostate cancers promotes tumor growth through accumulation of p62
doi: 10.1101/2025.05.02.651776
Figure Lengend Snippet: ( A ) Tukey boxplot of ATG5 mRNA expression levels in normal prostate tissue, low-grade (Gleason score ≤7) tumors, and high-grade (Gleason score >8) tumors from the TCGA PRAD dataset (*, p<0.01; **, p<0.0001). ( B ) Kaplan-Meier curves comparing overall survival of TCGA PRAD patients possessing tumors with high or low ATG5 mRNA expression. The Mantel-Haenszel hazard ratio (HR) was determined, along with the 95% confidence interval (CI) and Log-rank test p-value (p<0.05). ( C ) Quantification of ATG5 IHC staining was determined from patient samples (N=28) with ≥3 benign and tumor glands for in-patient comparison using the following equation: H-score = [1 x (% cells 1+) + 2 x (% cells 2+) + 3 x (% cells 3+)]. Statistical significance (p<0.0001) was determined using a two-tailed Mann Whitney test in Prism10. ( D ) Representative images of ATG5 staining from benign glandular regions and tumor regions from human prostate tumors of GS7-9. Scale bar represents 100 μm. Dashed box areas are magnified within the insets.
Article Snippet: Slides were cooled for 20 min, washed with water, blocked with Biocare Blocking Reagent (#BS966M) for 10 min and incubated in
Techniques: Expressing, Immunohistochemistry, Comparison, Two Tailed Test, MANN-WHITNEY, Staining
Journal: bioRxiv
Article Title: Loss of ATG5 expression in a subset of human prostate cancers promotes tumor growth through accumulation of p62
doi: 10.1101/2025.05.02.651776
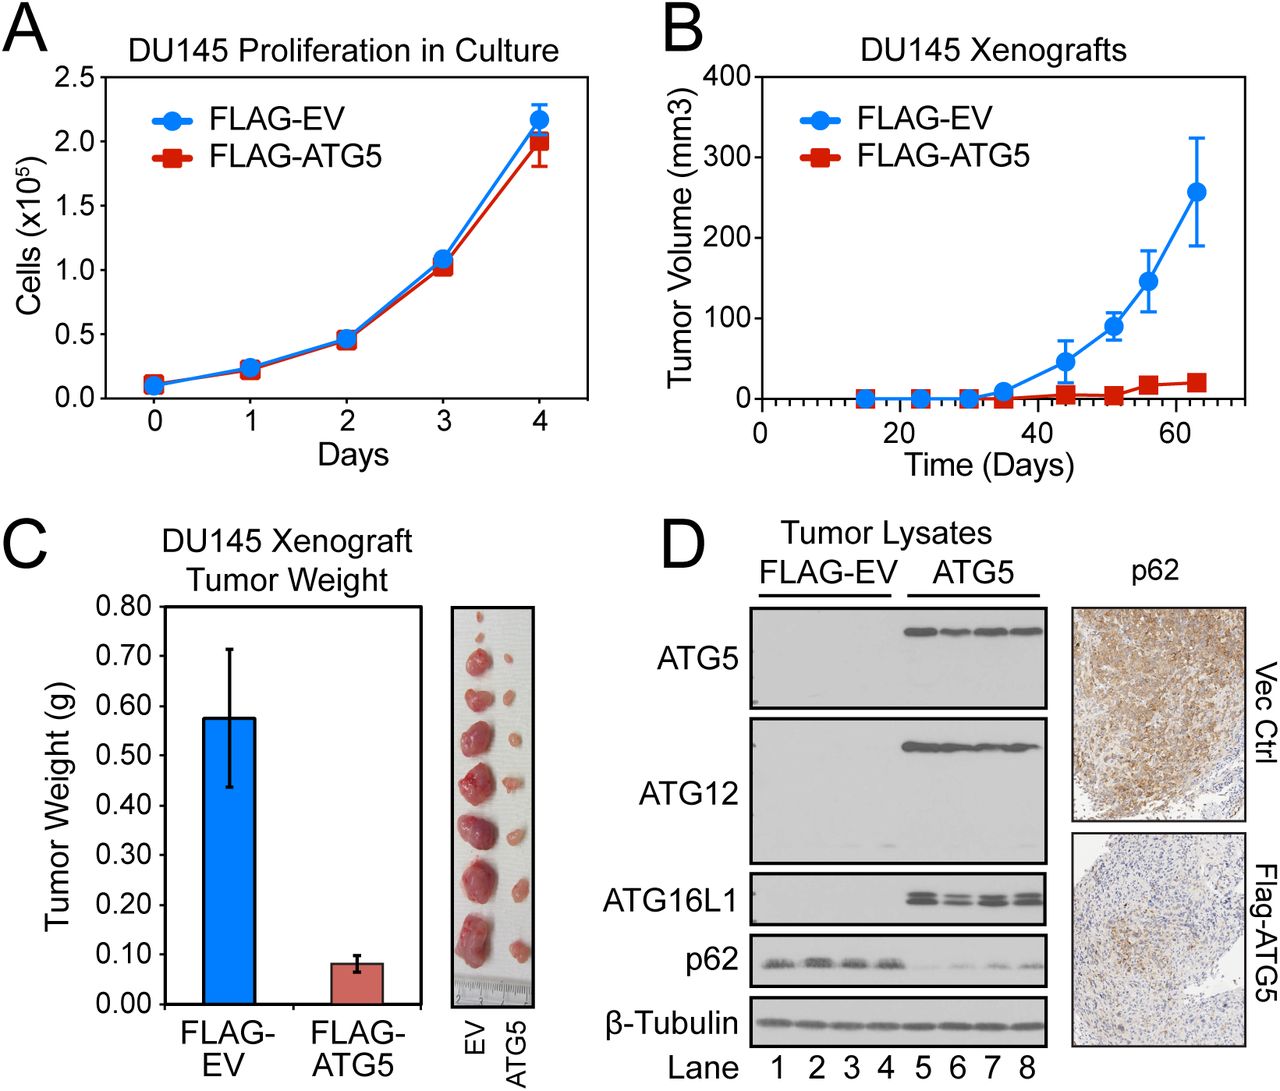
Figure Lengend Snippet: (A and B) 1×10 4 DU145 PCa cells, stably expressing firefly luciferase fused to mCherry and an empty vector (EV) or FLAG-ATG5, were plated in duplicate into 6-well plates. Total cell numbers were quantified daily by flow cytometry for 5 days. The same cell lines were likewise injected subcutaneously into the flanks of NOD/SCID mice, and xenograft tumor growth was determined by weekly measurements of luciferase activity using the IVIS Spectrum in vivo imaging system. (C) Mice were sacrificed and the tumors from empty vector (EV) and FLAG-ATG5-expressing DU145 xenografts were harvested, weighed and photographed. (D) Lysates were prepared from EV (lanes 1-4) and FLAG-ATG5-expressing tumors (lanes 5-8) and immunoblotted for the ATG12–ATG5-ATG16L1 complex and p62. IHC was also performed for p62 on representative tumors.
Article Snippet: Slides were cooled for 20 min, washed with water, blocked with Biocare Blocking Reagent (#BS966M) for 10 min and incubated in
Techniques: Stable Transfection, Expressing, Luciferase, Plasmid Preparation, Flow Cytometry, Injection, Activity Assay, In Vivo Imaging

Journal: bioRxiv
Article Title: Loss of ATG5 expression in a subset of human prostate cancers promotes tumor growth through accumulation of p62
doi: 10.1101/2025.05.02.651776
Figure Lengend Snippet: ( A ) Tukey boxplot of p62 reverse phase protein array (RPPA) expression levels in low-grade (Gleason score ≤7) and high-grade (Gleason score >8) tumors from the TCGA PRAD RPPA dataset. ***, p<0.0001. (B) Kaplan-Meier curves comparing overall survival of TCGA PRAD patients possessing tumors with high or low p62 RPPA expression. The Mantel-Haenszel hazard ratio (HR) was determined, along with the 95% confidence interval (CI) and Log-rank test p-value (p<0.05). ( C ) Tukey boxplot of SQSTM1 mRNA expression levels in low-grade (Gleason score ≤7) and high-grade (Gleason score >8) tumors from the TCGA PRAD dataset. **, p<0.001; ns, not significant. ( D ) Structure of p62 with its various functional domains and impacted signaling pathways. ( E ) DU145 cells were made deficient in p62 through CRISPR/Cas9-mediated deletion of SQSTM1 , and then infected with ATG5-expressing lentiviruses. ( F ) Wild-type and p62-deficient (p62 KO) cells – as well as those expressing ATG5 (DU145-ATG5 and DU145-ATG5-p62 KO) – were injected into both flanks of female NOD/SCID mice (0.5 x 10 6 cells per injection) and the resulting tumors were measured twice per week using calipers. Wild-type DU145 cells produced tumors larger than any other group by day 46 (p<0.01), and DU145-ATG5 cells produced tumors larger than p62-deficient cells only on day 63 (p<0.01). ( F ) Proposed model for how loss of ATG5 results in increased tumor growth.
Article Snippet: Slides were cooled for 20 min, washed with water, blocked with Biocare Blocking Reagent (#BS966M) for 10 min and incubated in
Techniques: Protein Array, Expressing, Functional Assay, Protein-Protein interactions, CRISPR, Infection, Injection, Produced
Journal: JID Innovations
Article Title: Characterizing Keratinocyte-Derived Extracellular Vesicles in UVB-Irradiated Murine Skin
doi: 10.1016/j.xjidi.2025.100406
Figure Lengend Snippet: EVs isolated from the dermis express K10. ( a ) Western blot of isolated dermal EVs from UVB-irradiated murine skin exhibits higher expression of K10 than those from sham-irradiated EVs. F1-5 represents a pooled sample of all 5 density gradient fractions from 1 male mouse. Skin lysate represents a positive control of homogenized whole skin (epidermis and dermis) UVB-irradiated skin tissue. ( b ) Pooled dermal EVs isolated from all 6 UVB-irradiated murine skin coexpress K10 on the captured CD9 + EVs more significantly than on the captured CD81 + EVs. P < .0001 for CD9 versus RatIgG. P = .001 for CD9 versus CD81. P = .055 for CD81 versus HamIgG. Exoview R100 analysis was used to capture EVs pooled from 6 UVB-irradiated male and female mice on a microarray chip by antibodies against the tetraspanin proteins CD9 and CD81 for validation of EV origin. EVs were permeabilized, and immunofluorescence staining was performed to detect coexpression of K10 with CD9 and CD81. Rat IgG isotype and Hamster IgG isotype were used as isotype controls for CD9 and CD81, respectively. Particle count was quantified by mean count ± SD. Bar graphs represent the mean particle count and corresponding SD across 3 distinct acquisition spots per capture antibody (CD81 and CD9). Statistical significance was assessed using multiple unpaired t -tests. ( c, d) Bar = 100 nm. Immunogold labeling electron microscopy of UVB-irradiated dermal EVs using ( c ) anti-K10 primary antibody and ( d ) isotype-matched control antibody, followed by 12-nm colloidal gold-conjugated goat antirabbit secondary antibody. Black arrows indicate immunogold-labeled secondary antibody binding to K10 on EVs. ( e) K10 expression in EVs is significantly higher in UVB-irradiated dermal EVs than in sham-irradiated EVs ( P = .0224) through flow cytometry. Dermal EVs from each individual mouse (6 UVB mice and 4 sham mice) were isolated and stained with a fluorescent-labeled K10 antibody. Each data point represents EVs from 1 mouse. Permeabilized EVs were bound to aldehyde/sulfate beads and stained with Alexa Fluor 700 Mouse anti-K10 (and matched isotype control). Statistical significance was assessed using an unpaired t -test. EV, extracellular vesicle; K10, cytokeratin 10.
Article Snippet: Antibodies used include
Techniques: Isolation, Western Blot, Irradiation, Expressing, Positive Control, Microarray, Biomarker Discovery, Immunofluorescence, Staining, Labeling, Electron Microscopy, Control, Binding Assay, Flow Cytometry
Journal: Applied and Environmental Microbiology
Article Title: Discovery of Stable and Variable Differences in the Mycobacterium avium subsp. paratuberculosis Type I, II, and III Genomes by Pan-Genome Microarray Analysis
doi: 10.1128/aem.01683-08
Figure Lengend Snippet: FIG. 1. Microarray data for validation hybridization comparing the two sequenced reference strains, using M. avium subsp. hominissuis 104 as the test strain and M. avium subsp. paratuberculosis K-10 as the reference strain per other strain comparisons. Scatter plots show the signal intensities for the test (y axis) versus the reference (x axis) strain channels. Data points are colored according to the BLAST prediction based on the sequence: black, predicted to be present in both the test and reference strains; light gray, predicted to be present in the test strain only; dark gray, predicted to be present in the reference strain only. Diagonal lines represent twofold cutoffs applied to each strain for each of the analysis methods used. MAH, M. avium subsp. hominissuis; MAP, M. avium subsp. paratuberculosis.
Article Snippet: The labeled sample was loaded on to a prehybridized (3.5 SSC [1 SSC is 0.15 M NaCl plus 0.015 M sodium citrate], 0.1% SDS, 10 mg/ml
Techniques: Microarray, Biomarker Discovery, Hybridization, Sequencing
Journal: Oncogene
Article Title: The human DEK oncogene stimulates beta catenin signaling, invasion and mammosphere formation in breast cancer
doi: 10.1038/onc.2011.2
Figure Lengend Snippet: A) Western blotting for DEK revealed high expression in ten breast cancer cell lines and the non-tumorigenic MCF10A immortalized human mammary epithelial cell line compared to two primary normal breast samples from separate donors. Actin was used as a loading control. The blot is over-exposed to emphasize low expression in normal tissue (B) A tissue microarray was stained for the DEK protein (brown) by immunohistochemistry. Normal, abnormal, and cancerous tissue are shown: (a) normal tissue, (b) hyperplasia, (c) fibrocystic changes, (d) grade I carcinoma in situ , (e) grade II-III, and (f) grade III invasive ductal carcinomas. Low power images are at 100x total magnification.
Article Snippet: Tissue sections from paraffin-embedded MDA-MB-468 NTsh xenograft tumors from the mammary gland were deparaffinized, underdwent antigen retrieval with 10 mM sodium citrate, and were blocked with 5% normal donkey serum and immunostained with
Techniques: Western Blot, Expressing, Microarray, Staining, Immunohistochemistry, In Situ

Journal: Oncogene
Article Title: The human DEK oncogene stimulates beta catenin signaling, invasion and mammosphere formation in breast cancer
doi: 10.1038/onc.2011.2
Figure Lengend Snippet: (A) MDA-MB-468, MCF10A, and MCF7 cells were retrovirally transduced with either empty vector (R780) or a DEK over-expression construct (R780:DEK). MDA-MB-468 and MCF7 cells were transduced with lentiviral shRNA constructs for non-targeting shRNA (NTsh) or two distinct DEK shRNAs (DEKsh2 or DEKsh5). Lysates were analyzed by Western blotting for DEK, cyclin A and Actin expression. (B) DEK over-expression significantly increases cellular growth rates in non-tumorigenic MCF10A cells and moderately increases growth rates in cancer cells. Population growth was monitored by plating equal numbers of control and DEK over-expressing cells then counting cell numbers over the course of five to seven days (p<0.05 in MCF10A cells, p=0.06 for MCF7 cells). (C) Loss of DEK expression inhibits growth in breast cancer cells. Population growth was monitored as in (B) immediately after selection in puromycin.. (D) Loss of DEK expression results in increased rates of apoptosis. MCF7 and MDA-MB-468 NTsh or DEKsh2 cells were stained for cleaved caspase 3 and analyzed by flow cytometry.
Article Snippet: Tissue sections from paraffin-embedded MDA-MB-468 NTsh xenograft tumors from the mammary gland were deparaffinized, underdwent antigen retrieval with 10 mM sodium citrate, and were blocked with 5% normal donkey serum and immunostained with
Techniques: Transduction, Plasmid Preparation, Over Expression, Construct, shRNA, Western Blot, Expressing, Selection, Staining, Flow Cytometry

Journal: Oncogene
Article Title: The human DEK oncogene stimulates beta catenin signaling, invasion and mammosphere formation in breast cancer
doi: 10.1038/onc.2011.2
Figure Lengend Snippet: (A) (Top) Loss of DEK expression impairs tumor growth in nude mice. MDA-MB-468 breast cancer cells transduced with lentiviral non-targeting shRNA (NTsh) or DEK shRNA (DEKsh2) were injected into the mammary fat pad of female nude mice (N=10 per cell line) and tumor growth was monitored with calipers for ten weeks. (Bottom) At necropsy, tumors were removed from the mammary gland and measured in three dimensions with calipers to calculate the final tumor volume (volume = (π/6)*(LxWxH)). (B) (Top) H&E images of representative tumors. T = tumor and N = necrosis. Arrows indicate normal mammary ducts. Immunohistochemical staining of tumors showed a correlation between DEK (middle panel) and ΔNp63 (bottom panel) staining. The H&E images are at 100x magnification. (Right) Western blotting of tumor lysates show down-regulation of ΔNp63 and upregulation of E-cadherin in DEKsh2 tumors. (C) DEKsh2 tumors had a higher percentage of cleaved caspase-3 positive cells, indicative of apoptosis, compared to NTsh-derived tumors. (Right) Representative immunohistochemistry images for caspase 3 staining. Arrows indicate representative positive cells. (D) DEKsh2 tumors had fewer BrdU-positive cells compared to NTsh-derived tumors. (Right) Representative immunohistochemistry images for BrdU staining. (E) Tumor cells exhibit co-expression of DEK with PCNA. Sections from paraffin-embedded NTsh derived tumors were immunolabelled for DEK (red) and PCNA (green).
Article Snippet: Tissue sections from paraffin-embedded MDA-MB-468 NTsh xenograft tumors from the mammary gland were deparaffinized, underdwent antigen retrieval with 10 mM sodium citrate, and were blocked with 5% normal donkey serum and immunostained with
Techniques: Expressing, Transduction, shRNA, Injection, Immunohistochemical staining, Staining, Western Blot, Derivative Assay, Immunohistochemistry, BrdU Staining
Journal: Cancers
Article Title: A Systemic and Integrated Analysis of p63-Driven Regulatory Networks in Mouse Oral Squamous Cell Carcinoma
doi: 10.3390/cancers15020446
Figure Lengend Snippet: Co-staining of p63 and COTL1 in B7E3 cells with induced p63 expression. Immunofluorescence images of p63 (green), COTL1 (red), and DAPI (blue) in B7E3 cells treated with no dox ( A ), 50 ng dox ( B ), or 200 ng dox ( C ).
Article Snippet: After blocking in 5% milk, the membranes were incubated first in primary antibodies against p63 (4A4, 1:20,000),
Techniques: Staining, Expressing, Immunofluorescence

Journal: Cancers
Article Title: A Systemic and Integrated Analysis of p63-Driven Regulatory Networks in Mouse Oral Squamous Cell Carcinoma
doi: 10.3390/cancers15020446
Figure Lengend Snippet: Co-immunofluorescence of p63 and COTL1 in human OSCC tissue. Two independent samples of well-differentiated, moderately differentiated, and poorly differentiated human OSCC tissues were co-stained for p63 (green) and COTL1 (red), and imaged at 20× magnification. DAPI (blue) was used as a nuclear stain.
Article Snippet: After blocking in 5% milk, the membranes were incubated first in primary antibodies against p63 (4A4, 1:20,000),
Techniques: Immunofluorescence, Staining

Journal: Cancers
Article Title: A Systemic and Integrated Analysis of p63-Driven Regulatory Networks in Mouse Oral Squamous Cell Carcinoma
doi: 10.3390/cancers15020446
Figure Lengend Snippet: Immunohistochemical staining in HNSCC tumor microarray tissues. Staining of p63 ( A ), COTL1 ( B ), and K14 ( C ) across normal, malignant tumor stage II, and malignant tumor stage III tissues at 10× magnification.
Article Snippet: After blocking in 5% milk, the membranes were incubated first in primary antibodies against p63 (4A4, 1:20,000),
Techniques: Immunohistochemical staining, Staining, Microarray